01 Jul Top Dos & Don’ts When it Comes to Digital Reports
If your reports aren’t focused or don’t truly tell the story of the data, I challenge you to ask yourself, how much value does this report truly hold?
DO!
If I had just one piece of advice for my fellow analysts when it comes to creating digital reports it would be to remain focused. Focus is difficult for many of us in business and in life. With so many distractions in the world we live in, it’s challenging to remain focused on what truly matters. It is easy to be wrapped up in-the-moment with access to the world at the tip of our fingers. Politics, friends & family, Netflix, sports, keeping up with the Kardashians, and so much more can distract you from remaining focused. Defining what truly matters is up to us as individuals, based on our core values. For me, family, health, work, and my dogs are the defining qualities in life that matter most to me.
What truly matters to yourself in your life?
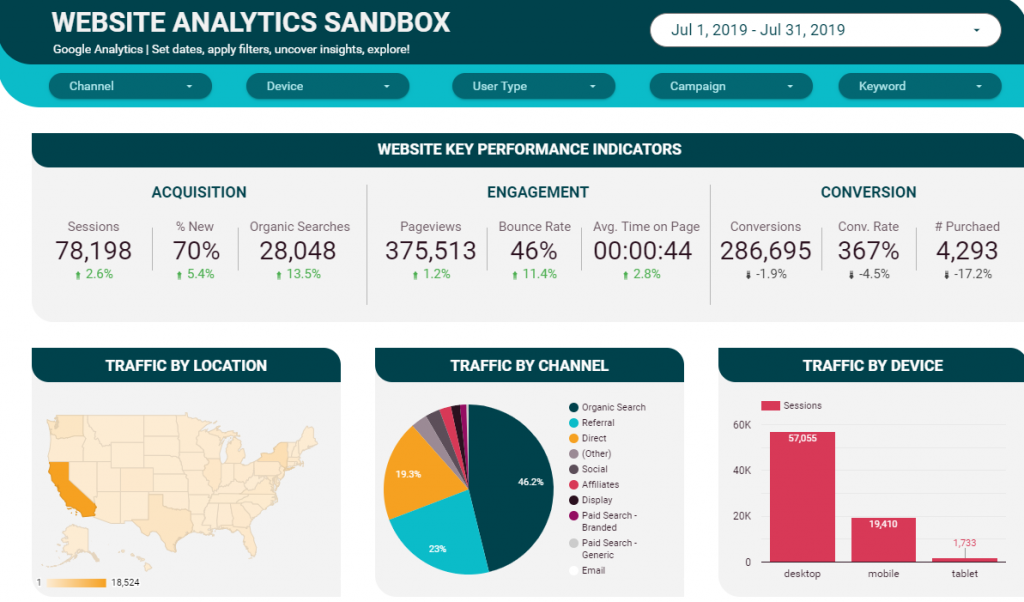
In business and in analytics alike we face similar challenges. In the current state of marketing, we are inundated with data. We have website data, competitive data, social media data, digital campaign data, customer data (CRMs such as Salesforce or Hubspot), third-party data from sources such as Census data, and so much more. How do we make sense of it all? How do we remain focused on what truly matters? This is why your digital reports are crucial in providing clarity to business owners. Your marketing report needs to drown out the noise of data that doesn’t drive business results. You may now be asking yourself, “how do I decide what data truly matters?”. Trust me, as an analyst, this is one of the most frequently asked questions of our clients. The answer lies in a simple five-step approach.
- Establish business objectives (examples – does your business need to generate leads for the sales team, sell products online, etc.?)
- Outline critical success factors (examples – are you looking to drive +10% more leads than last year, or sell $1,000,000 more worth of products?)
- Establish metrics for success, better known as KPIs (example – website contact form submissions, sales, etc.)
- Identify measurable targets (example – if you are looking to drive +10% more digital leads than last year, and last year you captured 100 leads, you need 110 leads this year)
- Analyze through marketing reports (example – now that you have identified your marketing KPIs, visualize these within your marketing report to remain focused on business growth)
DON’T!
The next piece of advice for my fellow marketers would be, don’t forget about the story. The focused approach to your marketing reports is only the first step in analyzing performance. How you bring it to life is done through data storytelling. At ROInsights, we preach the importance of the three pillars of marketing analytics;
- The Data
- Visualization
- Storytelling
If you take the focused approach as outlined above, you will have the appropriate data (1) for your marketing reports. When visuals (2) are applied to your data, they will bring to light insights that were previously hidden without seeing a chart or graph. Finally, when data AND visuals are paired with a story (3), it will explain to your audience what is happening, and why each insight is important in the most engaging way imaginable. The output of your marketing reports should be to provide clarity and enable the end-user to take action and make confident business decisions. Take action on trends and insights. Take action on the story the data is telling. Take action to drive better business results. When your marketing reports don’t tell the story, it is impossible to confidently take action on your report.
In summary, if your marketing reports aren’t focused, or don’t tell the story of the data, I challenge you to ask yourself how much value does this report truly hold?
Sorry, the comment form is closed at this time.